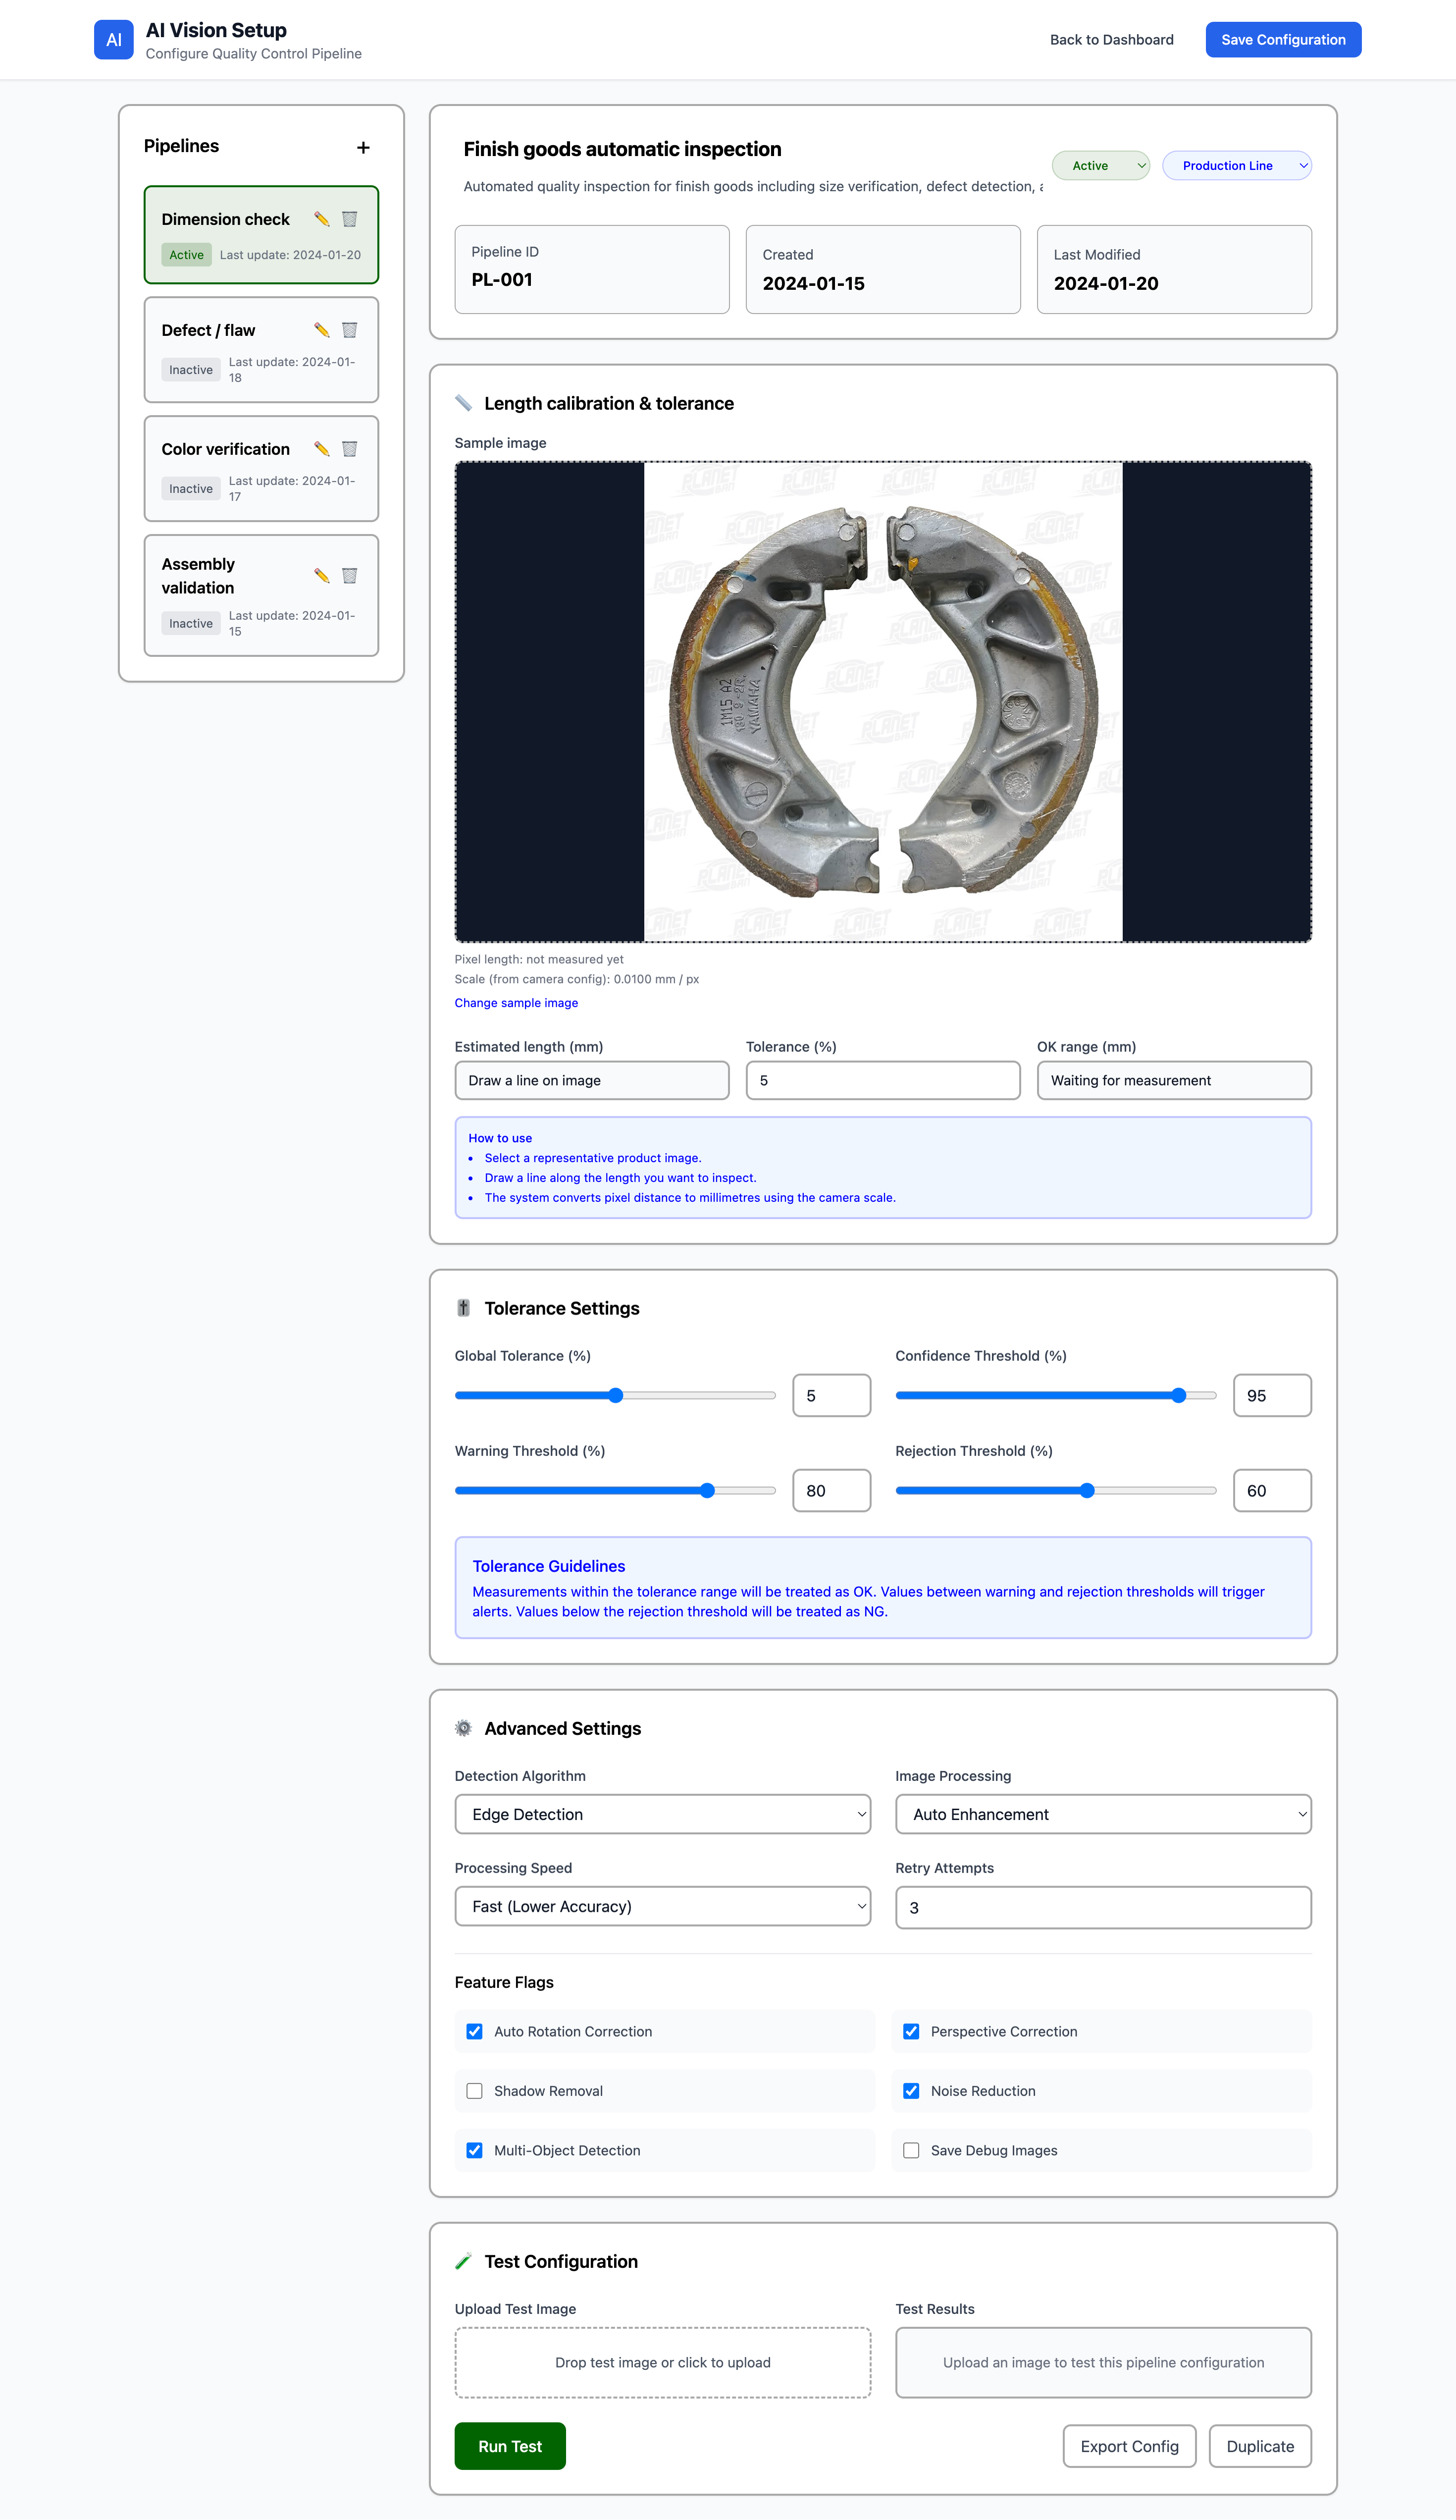
Gema AI Vision inspection UI for line operations
An AI vision quality inspection system, used by plant supervisors to monitor station results, review NG evidence, and export shift-level summaries.
Key Outcomes
Operational AI vision inspection across production stations
The repository implements UI flows for configuring inspection pipelines and monitoring live production runs, including station-level results, defect drill-down, and system health indicators.
Configuration + monitoring delivered as separate operational surfaces
The system splits concerns between pipeline configuration and production monitoring, with charted analytics and station drill-down to support day-to-day quality operations.
Related Case Studies
Explore similar projects across our portfolio
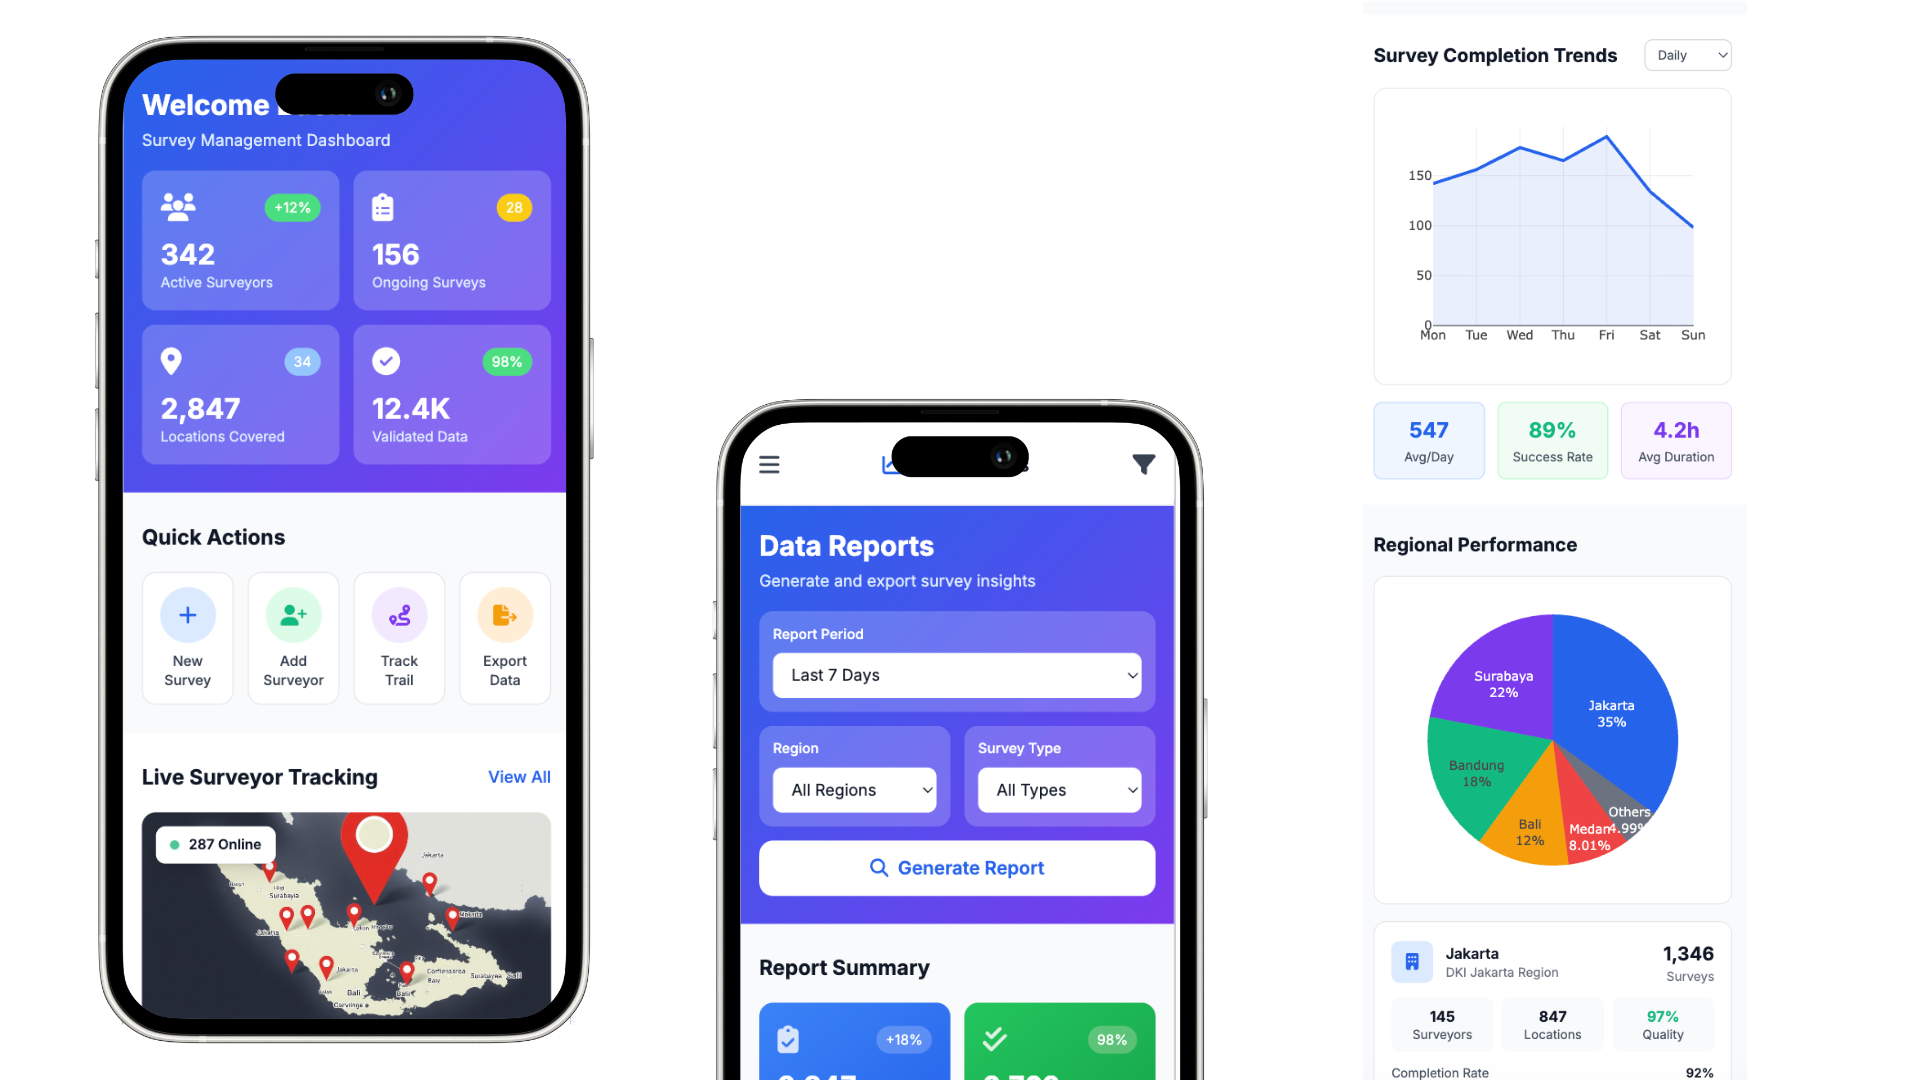
Market Survey Management System
Survey management platform to coordinate retail-market surveyors across Indonesia and deliver validated data to clients, with location-based features such as absence, geo-location, and surveyor trails.
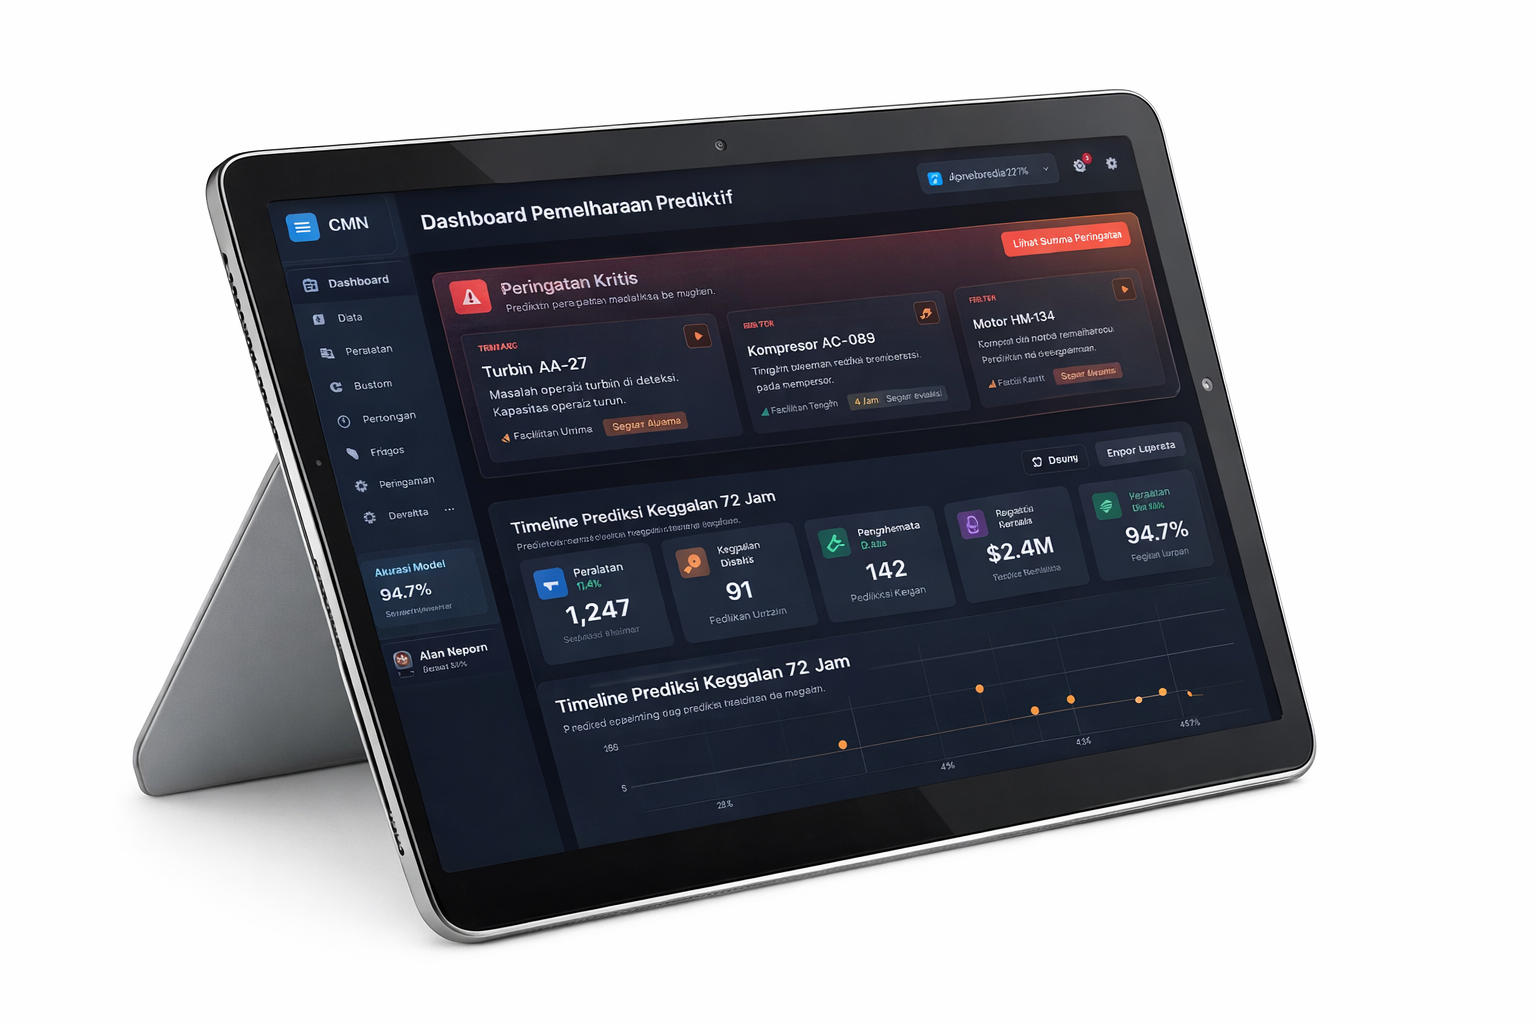
Predictive Maintenance AI
Machine learning system predicting equipment failures 72 hours in advance across multiple production facilities.
Ready to Transform Your Operations?
Let’s discuss how our engineering expertise can deliver measurable results for your organization.